
ROAS Is Dead? Performance Marketing Metrics That Matter (2026)
SEO Specialist · July 15, 2026
Table of Contents
- ROAS is not Dead. It Just Stopped Being the Boss.
- Why ROAS Stopped Telling the Whole Truth
- A Report Card versus a Bank Balance
- The Metrics that Actually Matter Now
- Blended ROAS, or MER
- Contribution margin, sometimes tracked as POAS
- LTV to CAC, with payback
- Incremental ROAS
- Over-Credited, Under-Credited: What Incrementality Reveals
- Why ROAS Refuses to Die
- How the Shift Happened
- Running the Metrics Together
- The Takeaway
- Frequently Asked Questions
ROAS is not Dead. It Just Stopped Being the Boss. #
Every few months, a headline declares that return on ad spend has died. It has not. What changed is the job ROAS is qualified to do. For most of the last decade, one ratio quietly ran entire marketing budgets: the revenue a platform attributed to your ads, divided by what you spent. It fit on a slide, it was easy to compare, and finance teams accepted it. Then the ground moved. Tracking got noisier, platforms started grading their own homework, and the number that looked cleanest on the dashboard became the least reliable guide to whether the business was actually making money.
The useful question is not whether to keep ROAS. It is which decision you are trying to make, and which metric answers it honestly. This guide covers the metrics that now carry the weight ROAS used to, the data behind the shift, and a simple way to run all of them together without letting any single number take over.
Why ROAS Stopped Telling the Whole Truth #
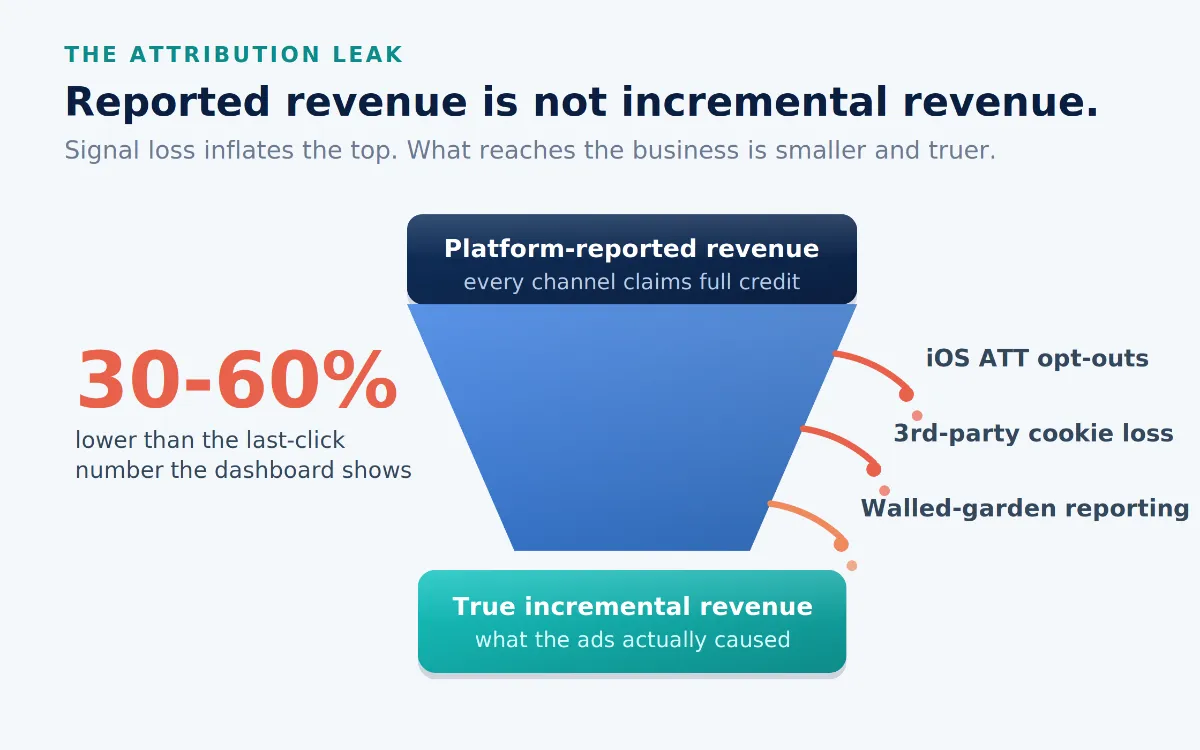
ROAS has one structural weakness that no amount of optimization fixes: it counts attributed revenue, not caused revenue. The word attributed does enormous work. A platform reports the sales it believes its ads generated, and every platform is motivated to claim as many of those sales as possible. Run Meta, Google, and TikTok together, add up what each reports earning, and the total often exceeds what your store actually took in. All three are taking a little credit for the same customer.
Two forces widened that gap. First, privacy changes cut the signal the platforms relied on. Apple's App Tracking Transparency, introduced with iOS 14.5 in 2021, let users decline cross-app tracking, and most did. Third-party cookies have been shrinking on the open web, and walled gardens limit what anyone can see across platforms. Second, acquisition itself got expensive. Per SimplicityDX research reported by Business of Apps (2024), the cost to acquire a customer has climbed by about 222% over roughly eight years, with the average brand now losing nearly $29 on a first order, up from $9. When the inputs get wobblier, and each customer costs more, a single confident output number becomes dangerous.
The compression shows up in the benchmarks. The average ecommerce ROAS fell to 2.87x in 2025, down about 4% year over year, according to Triple Whale's analysis of more than 35,000 brands. Rising costs can make a reported ROAS look healthy while the business quietly loses money, or make a channel that is doing real work upstream look weak. Either way, the number alone no longer settles the question.
A Report Card versus a Bank Balance #
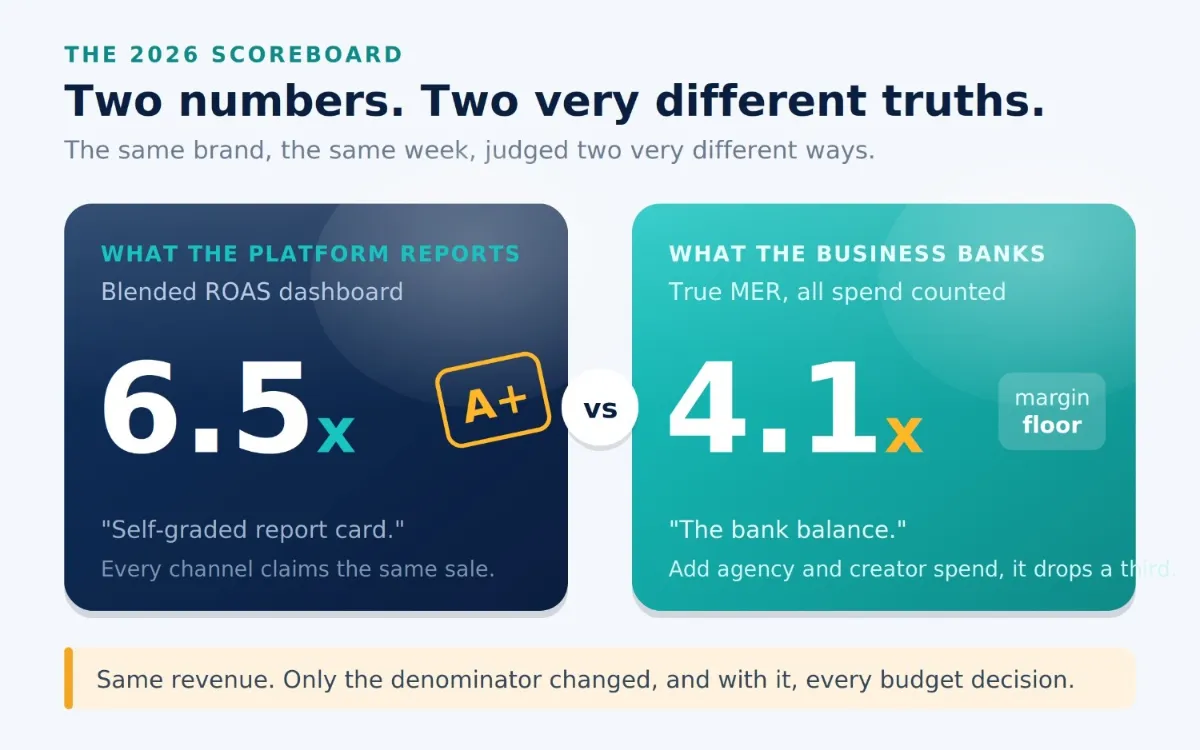
Here is the cleanest way to hold the two ideas apart. Platform ROAS is a self-graded report card: each channel decides how well it did and hands back an A. Marketing Efficiency Ratio, often called MER or blended ROAS, is closer to your bank balance. It divides total revenue by total marketing spend across all channels, both paid and organic, so no single platform can inflate the metric. This is also where organic search and email marketing are finally counted, since their revenue is included in the blended number even when no ad platform claims it.
The difference is not academic. Picture a brand whose dashboard shows a blended ROAS of 6.5, with the founder ready to pour more into creators. Once agency fees and creator payments are included in the denominator, true MER drops to 4.1, right at the margin floor. Same revenue, same week, a completely different decision. The creator line was not the growth lever it appeared to be.
MER will not tell you which campaign to pause, and it should not. It answers a bigger question: is the entire marketing engine generating profitable growth? For that reason, it belongs in the weekly and monthly review, not in the daily bid adjustments.
The Metrics that Actually Matter Now #
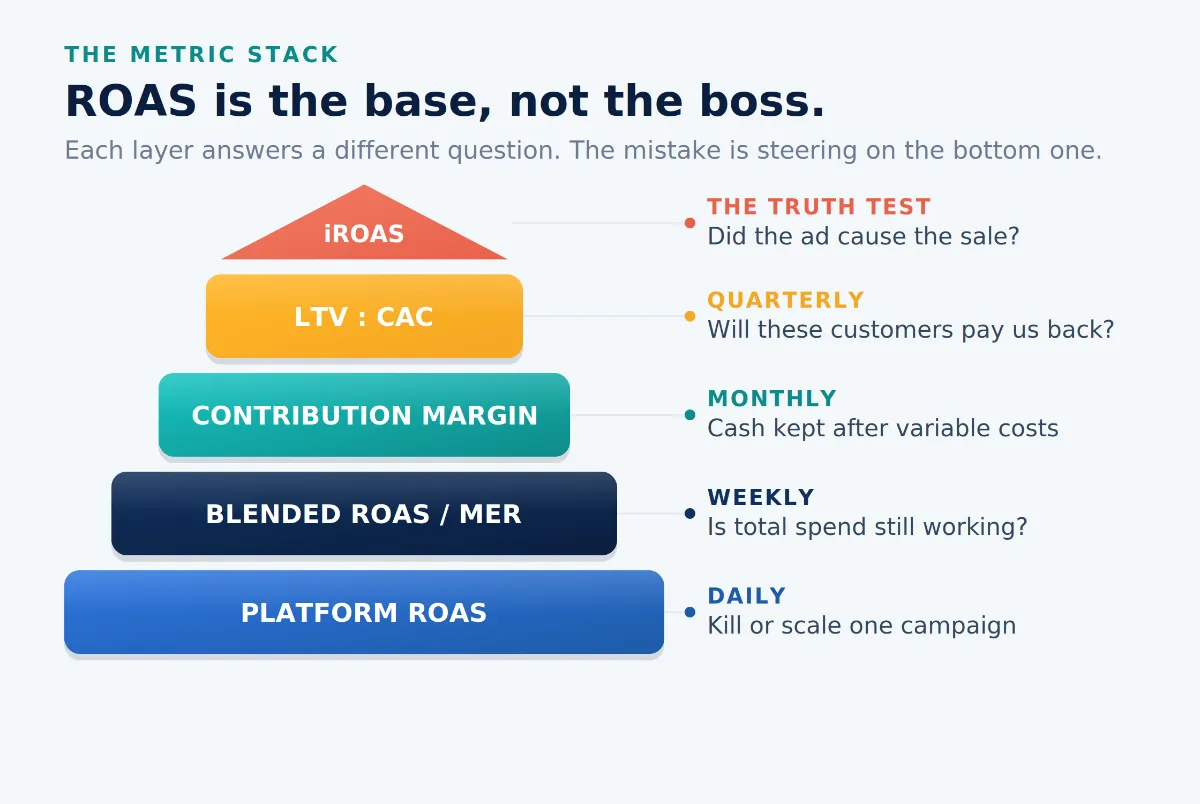
Think of measurement as a stack, not a single dial. Each layer answers a question the one below it cannot, and each has its own cadence.
Blended ROAS, or MER #
MER captures the halo that channel-level ROAS misses: paid social advertising that drives branded searches, paid search management that captures the intent it created, and repeat purchases that no first-touch model records. Advisors generally target an MER of 2.5 to 4.0 for growth-stage direct-to-consumer brands and 4.0 to 8.0 for mature ones, per Northstar's 2025 benchmarks, though the right number depends entirely on your margins, not on anyone's published range.
One trap catches teams new to MER. The number naturally dips as you scale paid media because you are buying revenue that used to arrive organically for free. A falling MER is not automatically a problem. What matters is the marginal return on the next dollar of spend. If that incremental dollar is still profitable, a lower blended average is simply the cost of growth, not a warning sign to pull back.
Contribution margin, sometimes tracked as POAS #
Revenue is not profit. A campaign can post a strong ROAS and still lose money once the cost of goods, shipping, payment fees, and returns are accounted for. Profit on ad spend, and its fuller cousin contribution margin after marketing, subtract those costs before dividing by spend. A 4.0x ROAS can shrink to a 0.4x profit picture once all variable costs are accounted for. This is the number that determines whether growth is worth pursuing, and it is where disciplined conversion rate optimization and healthy ecommerce marketing economics quietly deliver more profit than another round of bidding.
Mature operators break this down into layers: contribution margin after returns, then after the cost of goods, then after all variable costs, including marketing. The same logic produces your break-even ROAS, which is roughly one divided by your contribution margin. Keep 25 cents of profit per revenue dollar, and you break even at about 4.0x ROAS; keep 40 cents, and break-even drops to about 2.5x. Once you know that line, published industry benchmarks become context rather than goals, and you stop chasing a number someone else posted on a chart.
LTV to CAC, with payback #
A 2:1 ROAS on the first order can be a goldmine if those customers come back for years, and a 5:1 first-order ROAS can bankrupt you if they never return. Customer lifetime value relative to acquisition cost, plus how long it takes to earn it back, tells you whether acquisition is sustainable. The widely used floor is a 3:1 ratio, and with CAC up 40% to 60% between 2023 and 2025, the payback clock matters more than ever. Shopify's 2026 Global Commerce Report put the merchant-wide average acquisition cost at $ 318, up about 16% in a single year, based on data from 4.8 million merchants.
Incremental ROAS #
The metric at the top of the stack asks the hardest question: would this sale have happened anyway? Incrementality holds a comparable group out from seeing your ads, then measures the lift against them. What remains after subtracting the conversions that would have occurred on their own is the only return that truly belongs to the campaign. It is the closest thing performance marketing has to proof.
Over-Credited, Under-Credited: What Incrementality Reveals #
When brands finally run holdout tests, the pattern is consistent and uncomfortable. Click-heavy channels near the bottom of the funnel are over-credited, and upper-funnel channels are under-credited. In a published set of 225 direct-to-consumer geo tests run between August 2024 and December 2025, branded search returned a median incremental ROAS of just 0.70x, below the point where a dollar spent returns a dollar, while the full-portfolio median was 2.31x. The customer typing your brand name was mostly going to buy anyway.
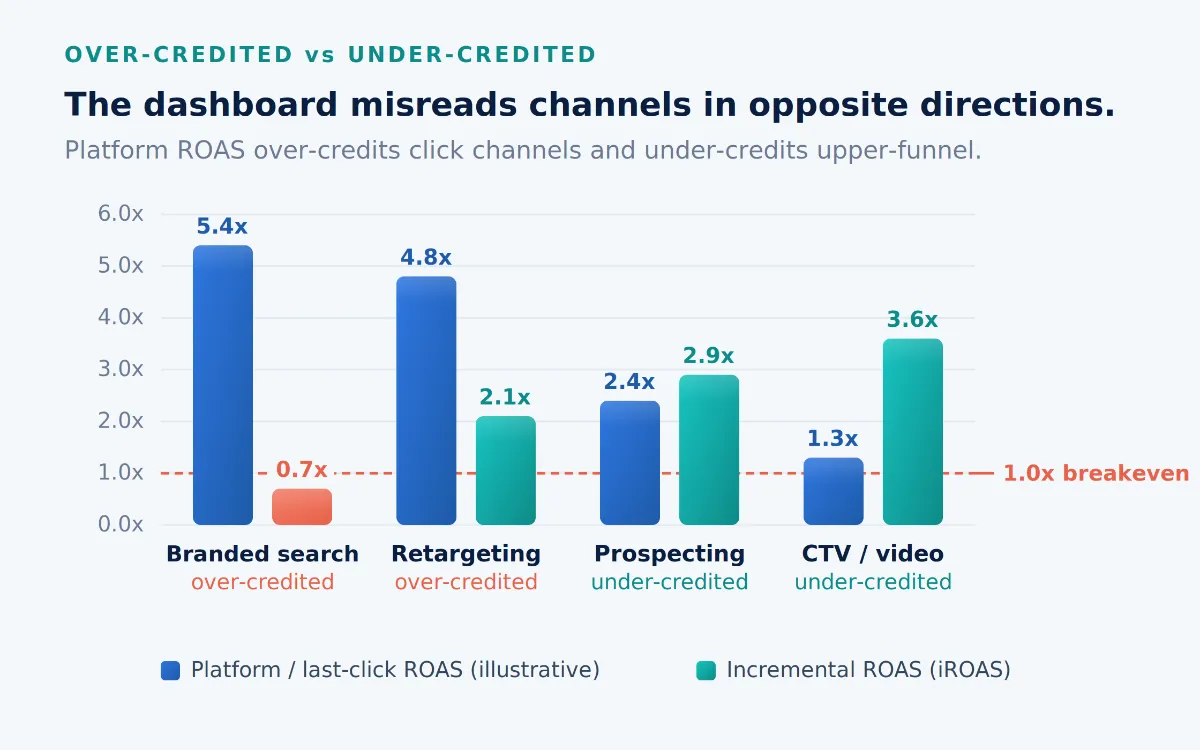
Specifically in retail media, incremental ROAS typically runs 30% to 60% below the last-click number that networks report, which matters as more brands push spend into marketplace and retail media advertising. That gap is why measurement moved. The Association of National Advertisers found that 71% of advertisers now rank incrementality as their single most important KPI, and by mid-2025 about 52% of US marketers were running incrementality tests, up from a niche practice two years earlier.
The good news is that the tooling has caught up. Simple geo holdouts, running ads in one set of comparable markets while pausing them in another, need no special software and give a directional read on whether a channel drives net-new sales or just harvests demand you already had. That accessibility is why causal testing moved from a large-enterprise luxury to standard mid-market practice in only a couple of years.
Why ROAS Refuses to Die #
For all of that, the eulogies are premature, and the reasons deserve a fair hearing. ROAS is the only common currency across a dozen different platform dashboards, so when a team is juggling several networks, it is often the one number everyone can read. It is simple, comparable, and it fits on a slide, which is exactly what a finance team wants when it asks whether spend is working and expects an answer in seconds rather than in the quarters an incrementality study takes. For smaller advertisers, rigorous geo experiments may not even pencil out against the spend involved. And plenty of brands really are fine most of the time steering by ROAS, as long as they know its limits. The honest position is not that ROAS is worthless. It is that ROAS should stop being the boss.
How the Shift Happened #
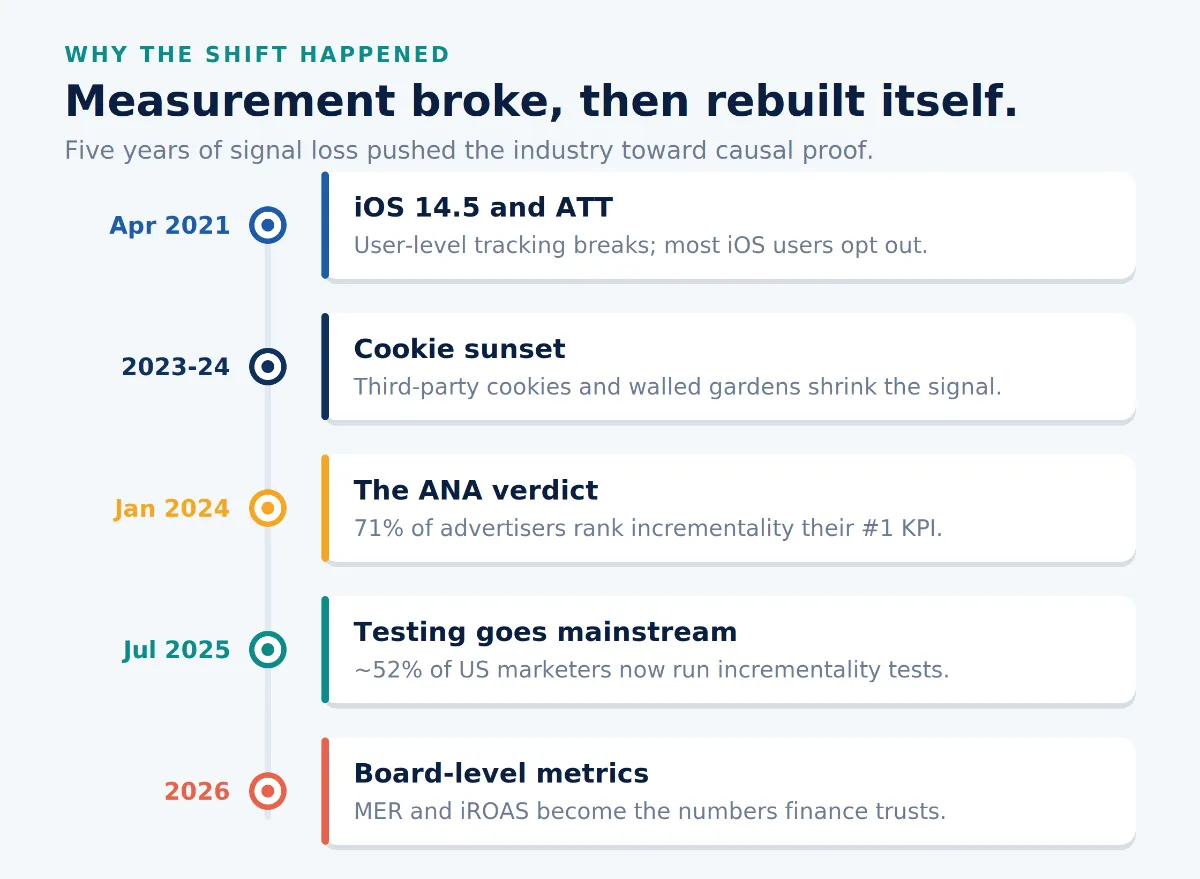
The move from platform attribution to causal proof did not happen overnight. It tracked the slow erosion of user-level data and a parallel squeeze on budgets. Gartner's 2025 CMO survey shows marketing budgets under pressure, and tighter budgets make proof of impact non-negotiable. Multi-touch attribution, which relied on the exact user-level signal that privacy changes removed, is now described by measurement specialists as no longer feasible for most brands. What replaced it is a blend: controlled experiments for causal proof in specific areas, and marketing mix modeling for the wide-angle view that platform reporting can never provide.
Running the Metrics Together #
The mistake is treating these as rivals, one true metric fighting to replace another. They are a stack with different jobs and different cadences, and the teams that win run all of them.
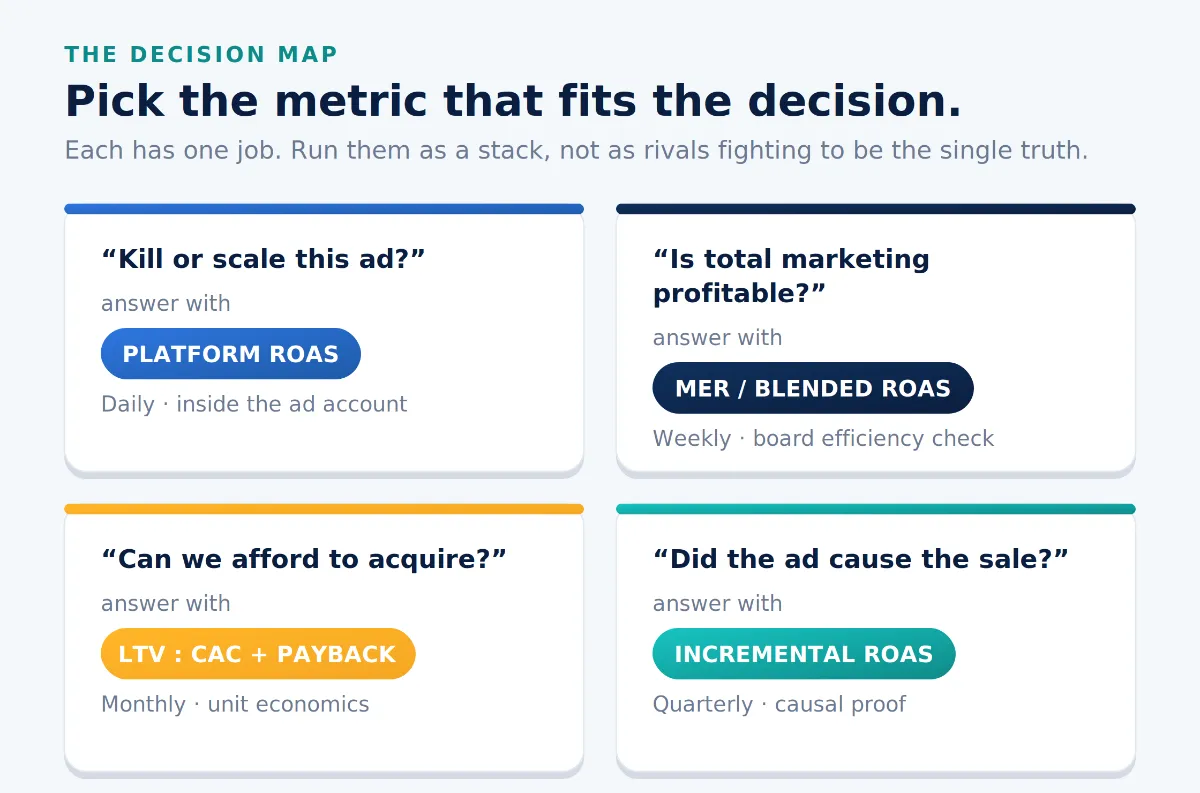
Use platform ROAS inside the ad account for daily kill-and-scale calls. Use blended ROAS or MER as the weekly efficiency check and the board number. Use LTV-to-CAC and payback monthly to decide how hard you can afford to push acquisition. Run incrementality quarterly, or sooner whenever a channel's reported return looks too good to trust, to learn what your budget is actually buying. First-party data makes it all sharper: brands with clean CRM and identity infrastructure consistently report lower acquisition costs than peers still relying on third-party signals.
The Takeaway #
ROAS did not die. It got demoted. It is still a fast, useful read on whether a single campaign is pulling its weight, and it earns its seat in the daily workflow. What it can no longer do is stand in for the business's health. The teams that compound their advantage over the next few years are the ones that read the whole stack: efficiency, profit, durability, and causation, each in its own review, none of them asked to carry the others. Write down which decision each of your current metrics is really answering; the gaps tend to show up fast.
Frequently Asked Questions #
Is ROAS dead?
No. ROAS still works for daily campaign decisions. It just should not be the only metric a whole budget answers to.
What is the difference between ROAS and MER?
ROAS is the revenue a platform attributes to its own ads divided by that channel's spend. MER is total revenue divided by total marketing spend across every channel.
What is a good ROAS in 2026?
There is no universal number. Your break-even ROAS is roughly 1 divided by your contribution margin, so a 50% margin breaks even at near 2.0x, and a 25% margin at near 4.0x.
What is incremental ROAS (iROAS)?
The return from sales that would not have happened without the ad, measured by holding a comparable group out and comparing the lift against them.
Why is my platform ROAS higher than my real return?
Platforms self-report and often claim the same sale, inflating modeled conversions. Incremental ROAS commonly runs 30% to 60% lower.
What is POAS?
Profit on ad spend. It subtracts cost of goods and other variable costs from revenue before dividing by ad spend, so it reflects profit rather than top-line revenue.
What LTV-to-CAC ratio should I aim for?
A 3:1 ratio is the widely used minimum for sustainable growth. Below it, you are usually buying customers at a loss; far above it, you may be underinvesting in growth.
Does MER replace ROAS?
No. MER judges whether total marketing is profitable, while ROAS still guides which specific campaigns to scale or cut. Run both.
How often should I run incrementality tests?
Quarterly for most brands, or sooner when a channel's reported return looks too good to trust. Smaller advertisers can start with simple geo holdouts.
What is the contribution margin after marketing?
Revenue minus cost of goods, fulfillment, payment fees, and marketing spend. It shows the cash each marketing dollar leaves behind to cover fixed costs.
Written by