
Heatmaps vs Session Recordings: Which Finds Conversion Leaks

Tuba
July 22, 2026
Table of Contents
- Key takeaways
- A Crowd Photo And a Security Tape
- What Heatmaps Catch That Recordings Never Will
- What Recordings Catch That Heatmaps Never Will
- So Which One Finds More Leaks?
- What the 2025 and 2026 Numbers Say About the Stakes
- The Workflow That Finds the Most Leaks
- Sample Sizes, Privacy, and What AI Changed in 2026
- Where This Leaves You
- Frequently Asked Questions
Key takeaways #Session recordings find more individual conversion leaks because they catch what heatmaps cannot see: broken forms, script errors, and visitor hesitation. Heatmaps find shared leaks faster because they compress thousands of visits into a single picture. The teams that plug the most leaks run heatmaps first to spot the pattern, then watch a small set of filtered recordings to explain it. |
Your analytics dashboard says the checkout is losing people. It cannot tell you why. That gap between what happened and why it happened is where conversion leaks hide, and it is exactly the gap heatmaps and session recordings were built to close.
The debate over heatmaps vs session recordings usually ends with a shrug and a polite suggestion to use both. Fair enough. But that answer skips the useful question: which one finds more leaks, and under what conditions? The two tools are not interchangeable. They catch different problems, need different amounts of data, and fail in different ways.
This guide breaks down what each tool actually catches, what the 2025 and 2026 data says about where revenue is leaking, and the exact order to use them so nothing slips through.
A Crowd Photo And a Security Tape #
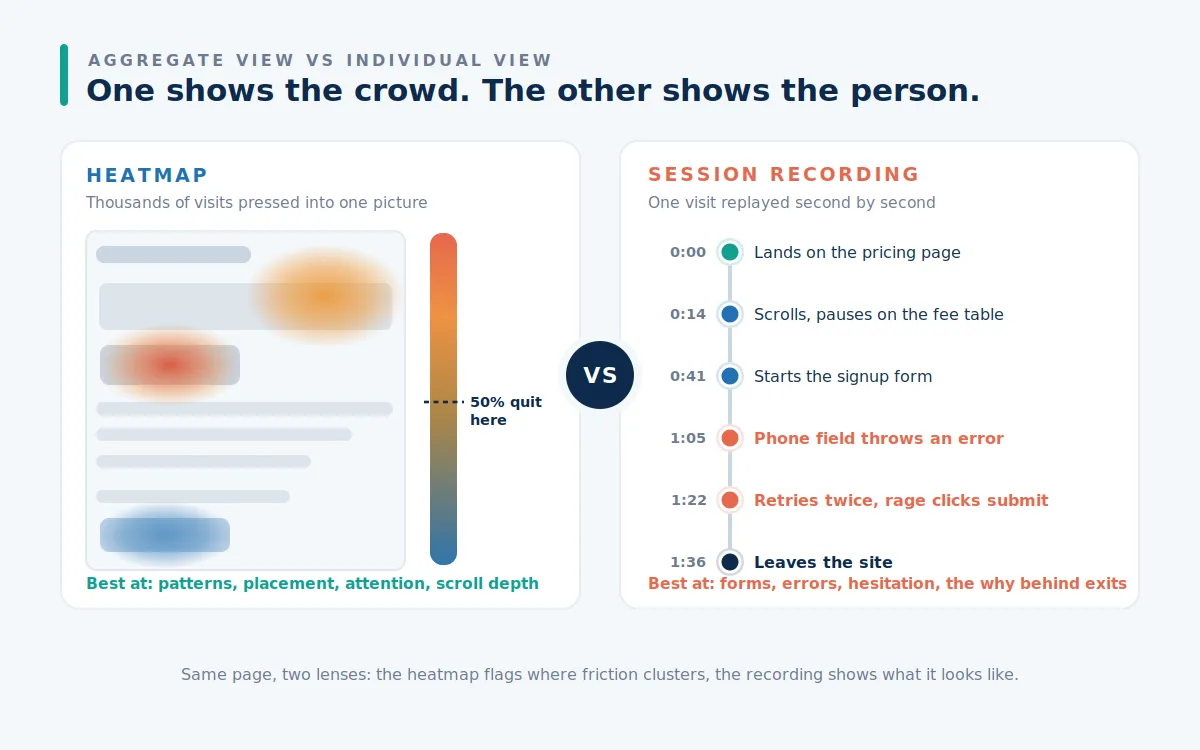
A heatmap is a crowd photo. It compresses thousands of visits into a single color-coded page image. Click maps show where people click, including dead clicks on elements that look interactive but are not. Scroll maps show exactly where readers stop. Attention maps show where cursors linger. Ten seconds of looking tells you what a spreadsheet never could.
A session recording is a security tape. It replays one anonymized visit second by second: every scroll, every pause, every retry on a form field, every rage click before the visitor gives up. Where the heatmap shows you that something is wrong with a page, the recording shows you what's going wrong.
That difference in altitude drives everything else in this comparison. Aggregate views are fast and statistically safe but shallow. Individual views are deep and specific but easy to over-read, because any single replay can be an edge case. Good conversion rate optimization treats them as two lenses on the same funnel rather than competing products.
What Heatmaps Catch That Recordings Never Will #
Heatmaps win wherever the leak is shared across visitors and visible in layout. Four leaks show up on a map within minutes:
The scroll cliff. A scroll map draws a hard line where most visitors stop. If your call to action sits below that line, no amount of copy polish will save it. This is the single most common finding on first-time heatmap reviews.
Dead clicks at scale. When hundreds of visitors click a product image or a plain heading expecting it to work, the map lights up. Each click is a request for a feature the page lacks.
Attention leaks. A decorative element or secondary link that pulls clicks away from the primary button appears instantly on a click map, but almost never in a handful of recordings.
Device splits. Comparing desktop and mobile maps side by side exposes layout breaks that bury buttons on small screens. These findings feed directly into web design decisions, since they are layout problems rather than persuasion problems.
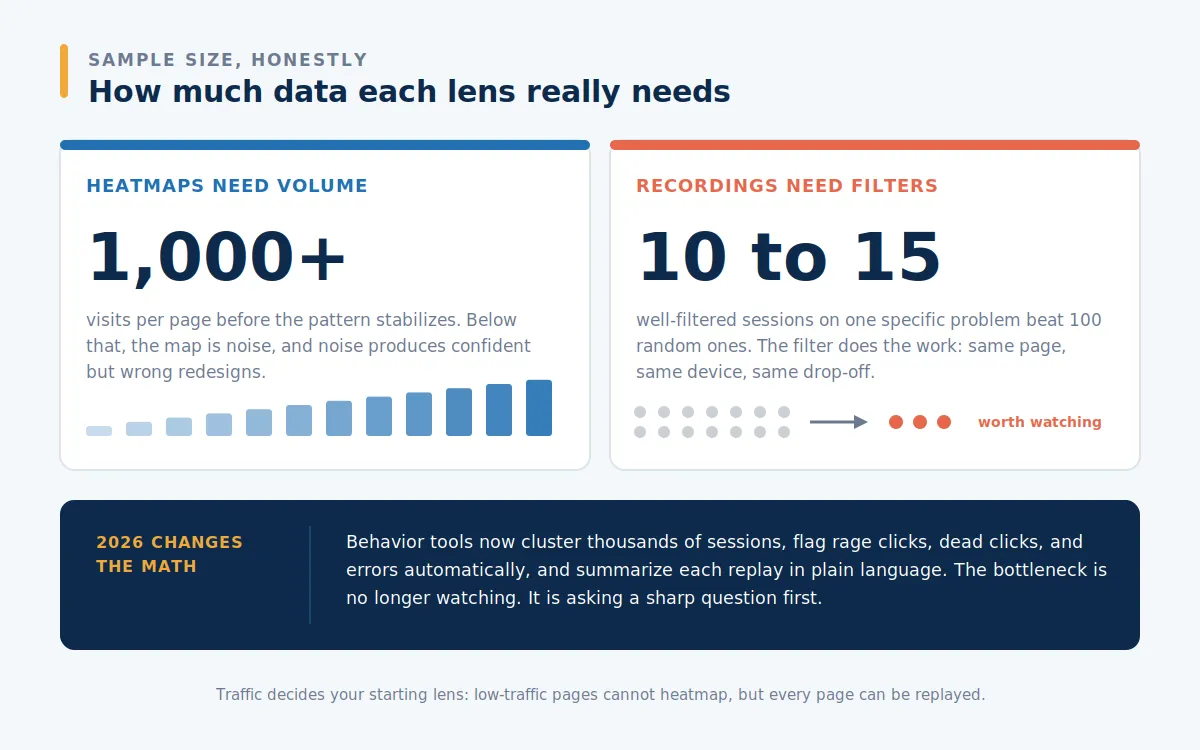
The catch is volume. Aggregate views only stabilize with enough data behind them. The working rule of thumb across behavior analytics vendors is a floor of roughly 1,000 visits per page, with 2,000 to 3,000 for revenue-driving pages. Below that, the map is noise, and noise produces confident but wrong redesigns.
What Recordings Catch That Heatmaps Never Will #
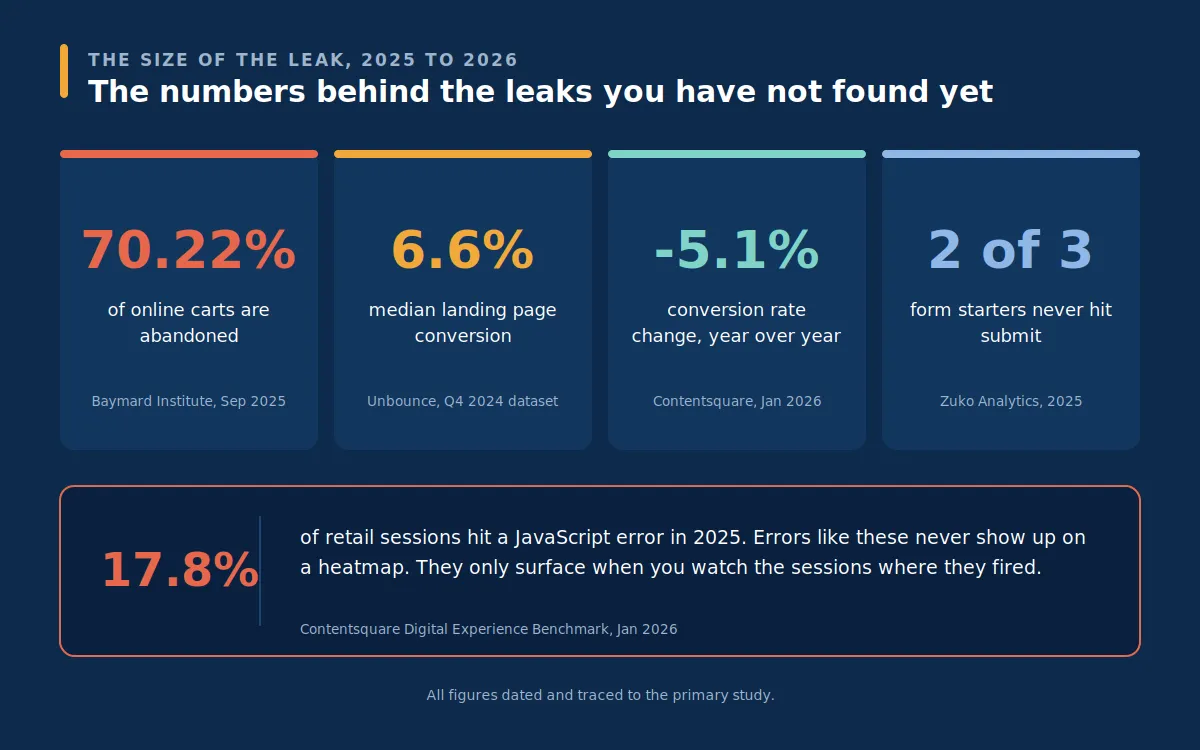
Whole categories of conversion leaks are invisible in aggregate, and they cluster around the most expensive real estate on your site: forms and checkouts. Zuko Analytics benchmarks published in 2025 show that roughly two-thirds of people who start filling out a form never submit it, and that purchase forms take 3 minutes and 21 seconds to complete on average, the longest of any form type. A heatmap of that form looks unremarkable. The recordings show the retries, the field that rejects a valid phone number, and the exact moment each visitor gives up.
Checkout tells the same story at larger scale. The Baymard Institute, whose meta-analysis was last updated in September 2025, reports an average cart abandonment rate of 70.22 percent across 50 studies. Baymard's checkout research also finds the average US checkout displays 23.48 form elements against an ideal of 12 to 14, and that 18 percent of US shoppers have abandoned an order because checkout was too long or complicated. Recordings are how you find which of those 23 elements is doing the damage on your checkout specifically.
Recordings also catch the quiet leaks: the visitor who hesitates at the pricing table, tabs away to compare, and returns colder. The error that only fires on one browser. The coupon field that sends buyers off hunting for codes. None of these render on a map, because a map has no concept of time, sequence, or failure.
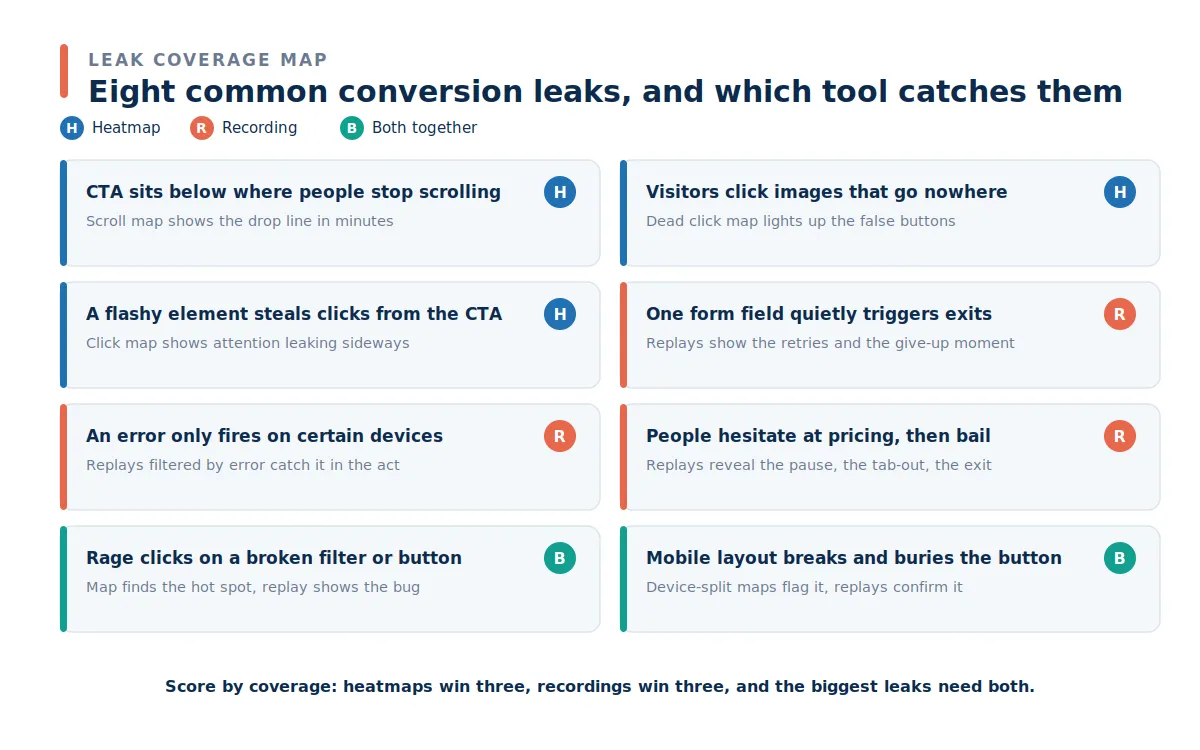
Frustration signals sit in the overlap. A rage-click cluster appears on a click map as a hot spot, but only a recording can tell you whether the element is broken, slow to respond, or simply misleading. That is why the strongest tools now expose both views of the same signal, and why the eight leaks below split the way they do.
So Which One Finds More Leaks? #
Score it by leak category and the answer is direct: session recordings surface more distinct conversion leaks, because entire classes of problems never appear in aggregate. Technical failures are the clearest case. Contentsquare's 2026 Digital Experience Benchmark, published in January 2026 from 99 billion sessions across more than 6,500 sites, found JavaScript errors touched 17.8 percent of retail sessions in 2025, and API errors rose 16 percent year over year as sites lean harder on third-party integrations. Every one of those failures is a potential leak, and none of them shows up on a heatmap.
But heatmaps find shared leaks faster and with more statistical confidence. A pattern built from thousands of visits cannot be dismissed as one weird session. When the leak is structural, wrong placement, ignored sections, or a false floor that stops scrolling, the map finds in ten minutes what fifty recordings would only hint at.
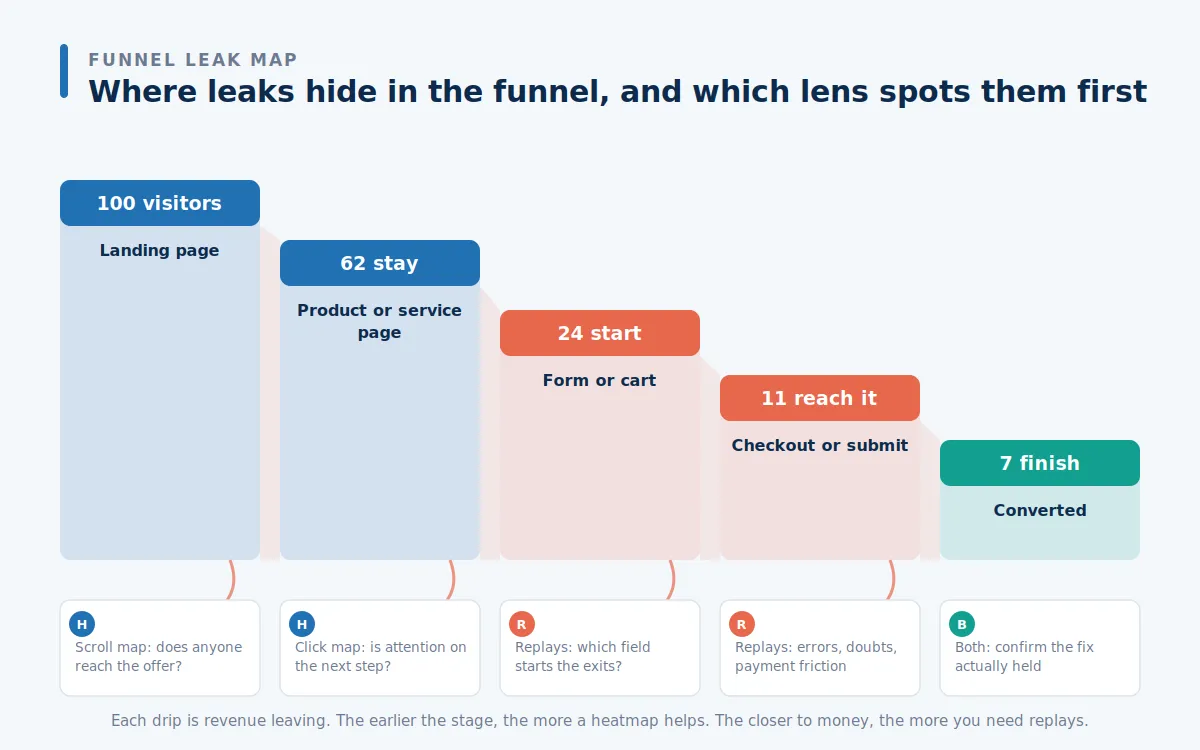
Funnel position settles most of the remaining argument. Early-funnel leaks on landing and product pages are usually layout and attention problems, which is heatmap territory. The closer a visitor gets to money, forms, carts, payment, the more the leaks become individual, sequential, and technical, which is recording territory.
What the 2025 and 2026 Numbers Say About the Stakes #
The macro data explains why this matters more now than it did two years ago. Contentsquare's 2025 benchmark, published in January 2025, reported conversion rates down 6.1 percent year over year while the cost of a visit rose 9 percent. Its January 2026 follow-up showed conversions falling another 5.1 percent. Traffic keeps getting more expensive, and it converts less. Every unfound leak now costs more than it did the last time you looked.
The same reports point to the upside. Contentsquare found that sites that increased session depth by 10 percent or more saw an average 5.4 percent lift in conversions, and its 2026 data shows frustration signals like rage clicks falling 4.3 percent as teams fix what their behavior tools surface. Meanwhile, Unbounce's Conversion Benchmark Report, built on 57 million conversions across 41,000 landing pages, puts the median landing page conversion rate at just 6.6 percent, with industry medians running from 3.8 percent for SaaS to 12.3 percent for events and entertainment. The distance between a median page and a top performer is not magic. It is found leaks, plugged in order of cost.
For paid traffic, the math doubles. A leak taxes your paid search campaigns twice: once when you pay for the click, and again when the visitor hits the leak and leaves. Behavior data is the cheapest insurance a media budget can buy.
The Workflow That Finds the Most Leaks #
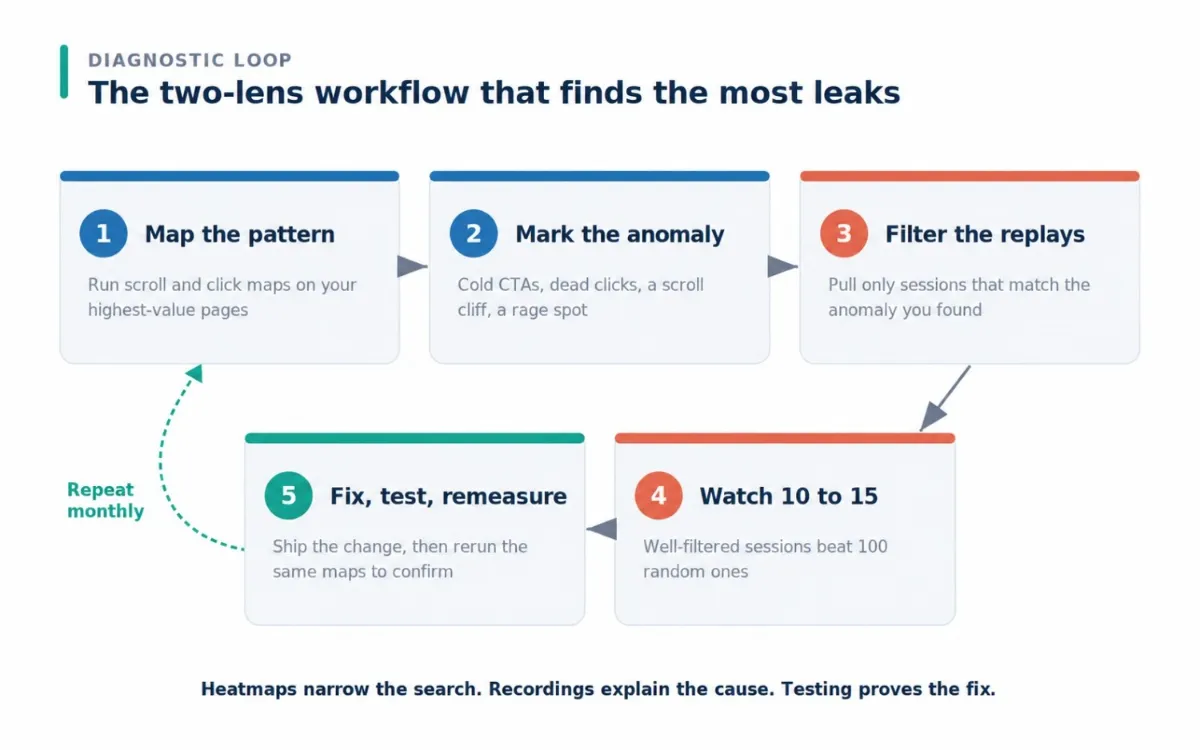
The order matters more than the tools. Teams that watch recordings cold burn an afternoon and ship nothing. Teams that read maps without follow-up redesign on guesses. The sequence below fixes both failure modes:
Map the money pages. Run scroll and click maps on your highest-value pages once they have at least 1,000 visits of data.
Mark the anomaly. A cold call to action, a dead click cluster, a scroll cliff, a rage click hotspot. Write it down as a question, not a conclusion.
Filter the replays. Pull only sessions that match the anomaly: the same page, the same device, and visitors who dropped at that step.
Watch 10 to 15. Well-filtered recordings on one specific problem reveal the pattern. A hundred random ones reveal nothing.
Fix, test, remeasure. Ship the change, run it as a test where traffic allows, then rerun the same maps to confirm the leak actually closed.
One refinement worth stealing from analytics teams: anchor the loop to your GA4 funnel report. GA4 tells you which step is bleeding the most visitors, so your first heatmap goes on the biggest leak rather than the easiest page. Behavior tools explain drop-offs. Funnel reports rank them. Starting from the ranking keeps the whole loop focused on revenue rather than curiosity.
Run monthly, this loop compounds. Baymard's checkout research estimates that fixing documented usability issues can lift conversion by 35 percent for a large ecommerce site, which is the kind of gain that normally gets attributed to a redesign. It is really just leak-plugging with discipline, the core of any structured CRO program.
Sample Sizes, Privacy, and What AI Changed in 2026 #
Three practical realities decide how this plays out on your site.
Traffic decides your starting lens. Heatmaps need roughly 1,000 or more visits per page before patterns stabilize. Recordings need almost none, because ten well-chosen sessions on a low-traffic page still show you real behavior. If you run a niche ecommerce marketing operation with thin traffic on long-tail product pages, recordings are your first tool, not your second.
Privacy is now enforced, not suggested. Since October 31, 2025, Microsoft Clarity requires a valid consent signal before collecting data from visitors in the EEA, UK, and Switzerland. Without consent in place, session recordings and funnels for that traffic simply stop. Whatever tool you use, mask form inputs, exclude sensitive pages, and treat your recordings as personal data, because regulators do.
AI moved the bottleneck. The 2026 generation of behavior tools automatically clusters thousands of sessions, flags rage clicks, dead clicks, and errors, and writes plain-language summaries for each replay. Watching time has collapsed. The scarce skill now is asking a sharp question, which is exactly what the heatmap step of the workflow produces. The findings also feed the rest of your marketing: scroll data showing readers quit at 40 percent should change your content writing brief, and frustration signals like quick back-to-search-results drags on the engagement patterns your SEO strategy depends on. None of this removes judgment from the job, though. AI can tell you that thirty visitors struggled with the date picker. It cannot tell you whether the right fix is a new component or the removal of the field entirely.
Where This Leaves You #
Recordings find more leaks. Heatmaps find leaks faster. The verdict only matters if it changes what you do on Monday, so here is the short version:
If your key pages clear 1,000 visits, start with scroll and click maps and let the anomalies write your watchlist.
If your traffic is thin, or your problem lives in a form or checkout, skip straight to filtered recordings.
Either way, never redesign off a single lens. Maps without replays produce guesses. Replays without maps produce anecdotes. Together they produce fixes.
And if you would rather have a second set of eyes on where your funnel is leaking, a conversion audit is the fastest way to find out what your visitors already know.
Frequently Asked Questions #
What is the main difference between heatmaps and session recordings?
Heatmaps aggregate thousands of visits into one visual of clicks, scrolls, and attention. Session recordings replay one visitor's session so you can see exactly where they struggled.
Which one finds more conversion leaks?
Session recordings surface more distinct leaks, because errors, form struggles, and hesitation never appear on a heatmap. Heatmaps find shared, page-level leaks faster and with more confidence.
How many visits do I need before a heatmap is reliable?
Plan on at least 1,000 visits per page, and 2,000 to 3,000 for revenue-driving pages. Below that, the pattern is mostly noise.
How many session recordings should I actually watch?
Ten to fifteen well-filtered recordings on one specific problem usually reveal the pattern. The filter matters more than the volume.
Should I run heatmaps or session recordings first?
Run heatmaps first on high-traffic pages to find the pattern, then use filtered recordings to explain it. On low-traffic pages, start with recordings.
Are session recordings legal under GDPR?
Yes, when visitors consent, and sensitive inputs are masked. Since October 31, 2025, Microsoft Clarity has required a valid consent signal for traffic from the EEA, the UK, and Switzerland.
Do heatmap and recording scripts slow down a website?
Modern scripts load asynchronously and add little measurable delay for visitors. Test your page speed before and after installing, and remove any tool you stop using.
Is a free tool like Microsoft Clarity enough?
For most small and mid-sized sites, yes. Paid tools add form analytics, longer data retention, and deeper integrations, which matter mainly at scale.
Can AI automatically find conversion leaks in recordings?
Partly. Tools in 2026 cluster sessions, flag rage clicks, dead clicks, and errors, and summarize replays in plain language. They shortlist the leaks; a human still confirms the cause and the fix.
Why does my heatmap look fine but conversions stay low?
Because whole categories of leaks never show on a map, including script errors, failing form fields, and off-page doubts. Watch filtered recordings of visitors who did not convert.